
The Australian Carbon has rallied circa 6% in the past 30-day period as the demand from emitters and safeguard entities builds into end of Q1 2024.
| ACCU | Bid | Offer | 30 Day Volume | Demand |
|---|---|---|---|---|
| Generic | $35.25 | $35.75 | >500k Tonnes | High |
| HIR | $36.75 | $37.95 | >250k Tonnes | High |
| Savannah | $35.50 | $36.90 | >20k Tonnes | Low |
| Indig Savannah | $50.00 | $52.00 | >20k Tonnes | High |
| Soil Carbon | $55.00 | $60.00 | <5k Tonnes | Building |
| Reforestation (EP) | $55.00 | $58.00 | <5k Tonnes | High |

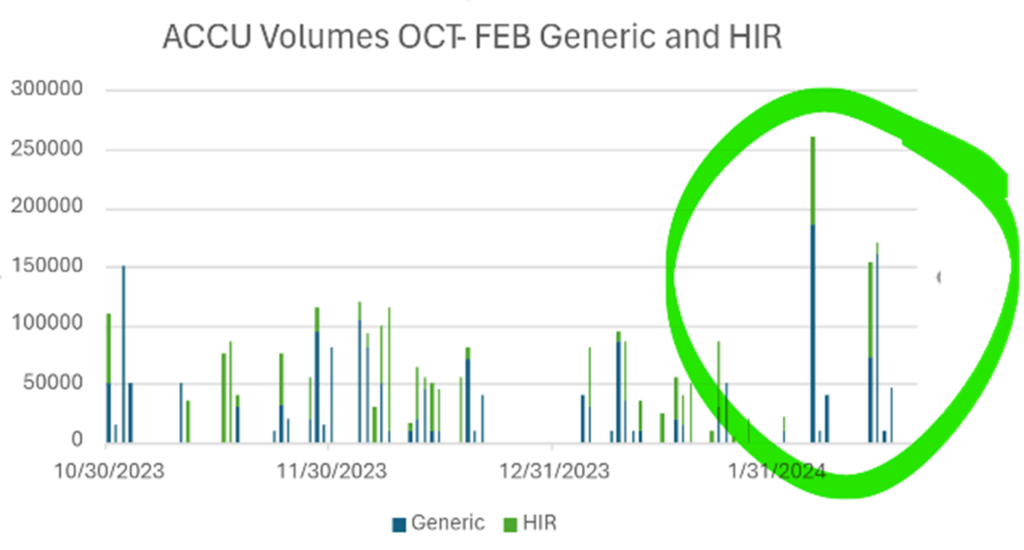
Recently, the generic and HIR markets have seen reasonable volumes of trade, particularly in the last month compared to the previous quarter, as indicated in the chart below.
The market is currently in a phase of subdued activity, reflecting and reassessing its strategies. The compliance sector is exploring strategies to postpone offset usage, provided there’s a credible path to establishing Safeguard Mechanism Credits (SMCs) within the next 5-7 years. Concurrently, the government’s commitment to Carbon Capture and Storage (CCS) as a viable decarbonisation strategy implies that large emitters may adopt similar approaches for medium-term compliance. Essentially, if a company can prove its potential to reduce emissions in the future through investments in new technologies or process changes, aligning with the required 4.9% year-on-year emission reduction, it can lessen its immediate need for ACCUs.
The current ACCU issuance modeling has proven inadequate, largely due to its reliance on registrations. This discrepancy is becoming evident as forecasted issuances fail to meet the regulator’s expectations.
The methodologies that create the bulk of the supply in the Australian Carbon Market are no longer valid methods.
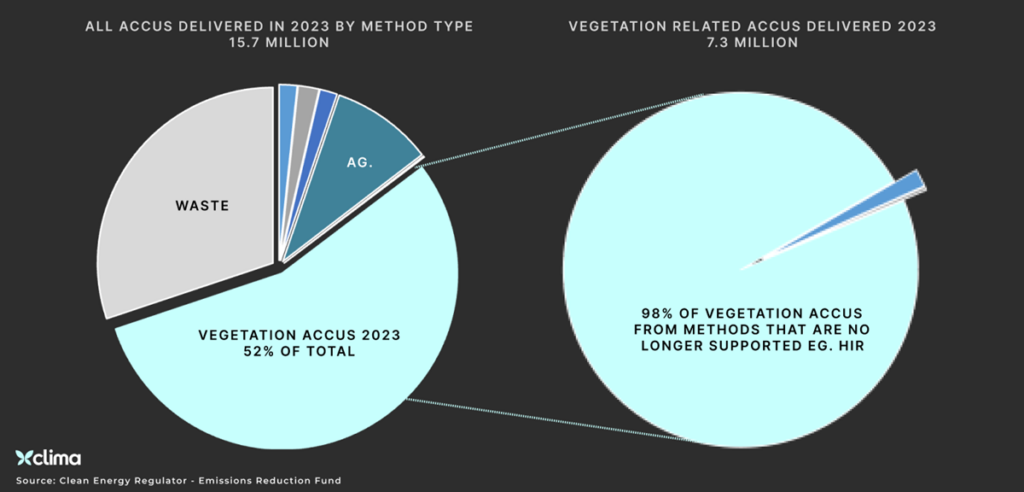
Methods like Landfill Gas, Human Induced Regeneration, and Savanna Burning are now discontinued. In their stead, new methodologies such as the Integrated Farm and Land Management (IFLM) method and a revamped Savanna Method are being introduced. These methods, however, are currently experiencing turbulence due to the cumbersome approval processes, creating bottlenecks in registration, planning, and most crucially, execution. This situation is further complicated by unprecedented levels of Monitoring & Verification requirements in the ACCU market.
The next couple of months will see more corporates and emitters enter the market and experience the misalignment of expectations and the realities of low availability of high integrity units.
With directors and sustainability managers becoming more aware of the risks, the market will provide solutions that address these issues, but it will take 24-36 months longer than we all expect.